Making topography has become much easier with present tools as lidar and CNC routers. I already knew the possibilities of bitmap to heightfield, ec. using black and white pictures to generate altitude differences in a cad file.
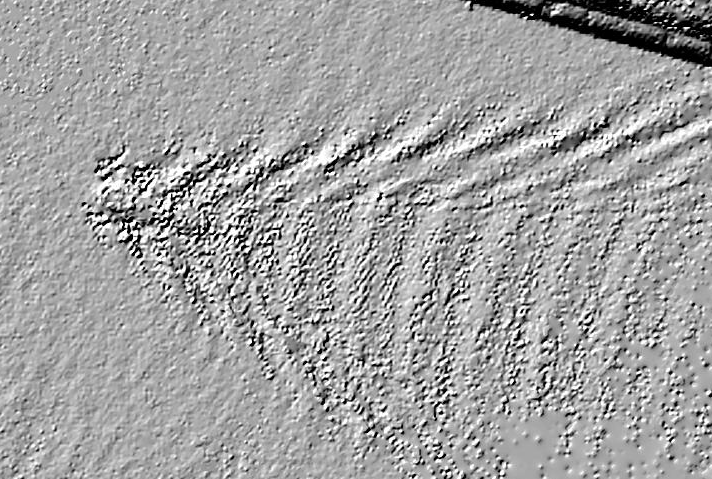
Present Lidar data is very accurate, but the data could be presented in a more usefull way: not in red to blue, but black to white. However, as it is not there yet, a filter had to be made to convert the color as good as possible. Next step: making tiles that can be combined, each with their own topography, that can be used in a project constructing and running a river. The tiles can have a determined topography, but another project would be: making hydraulical elements such as river bends, dikes, levees, a more or less porous soil, rough surfaces, mini-houses and other obstructions. It can vary from a very playfull up to very accurate representation of an existing situation, such as the river Waal near Lent or the IJssel where extensive renovations have taken place last 10 - 15 years (ruimte voor de rivier). Having a wetlab at a school can provide good teaching materials for students who have to learn about the interaction of water and society.
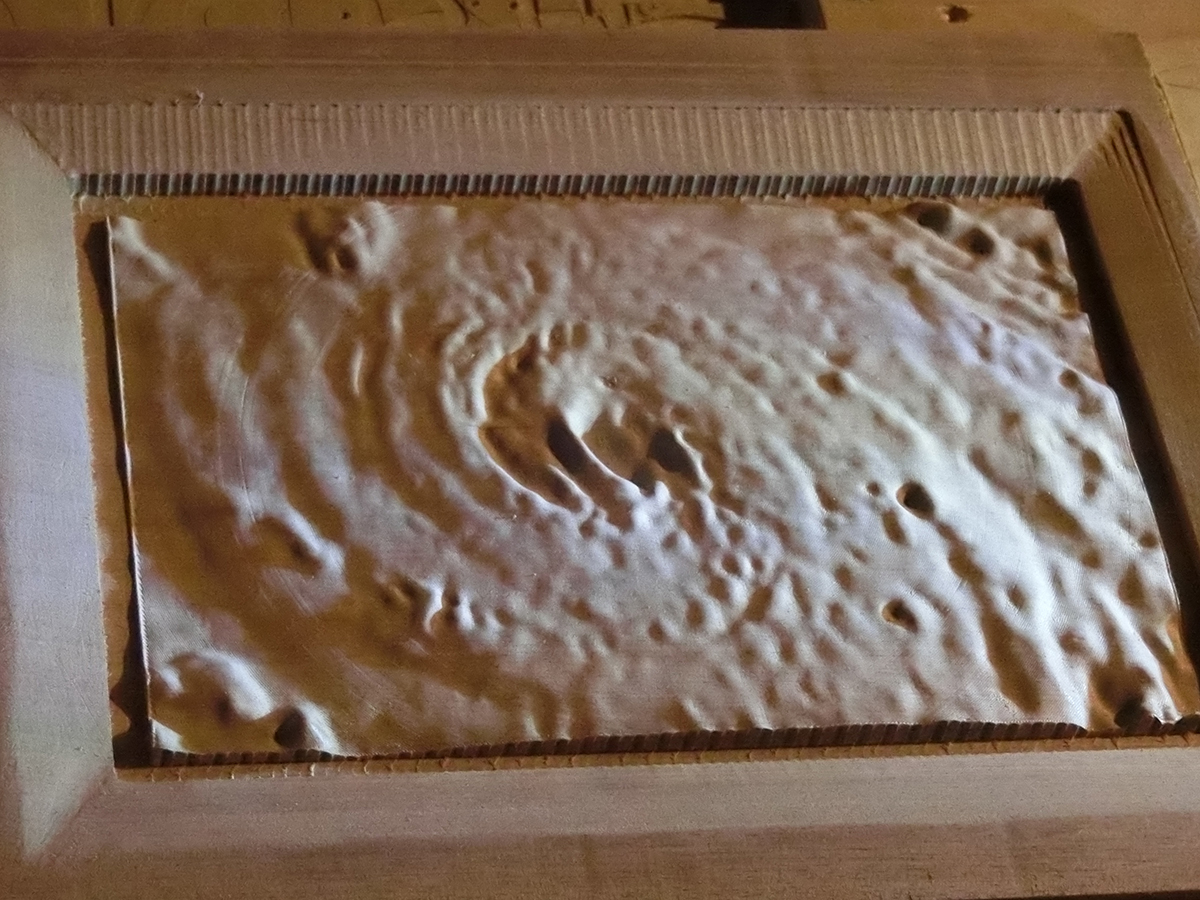
Also satellite images can be used to make reliefs, even though it will not give accurate results, the reliefs give a good impression of, here, the hurricane Irma that devasted the Caraibian Islands in 2017. Such images have a high dramatic value and can be used for projects. The possibility of downloading high accuracy geo data is an opportunity which should not be underestimated for local projects: it provides real data, usable results, it is recognizable and there is a lot to do regarding downloading and interpreting the data. Good for the skill development and the interest of the students.
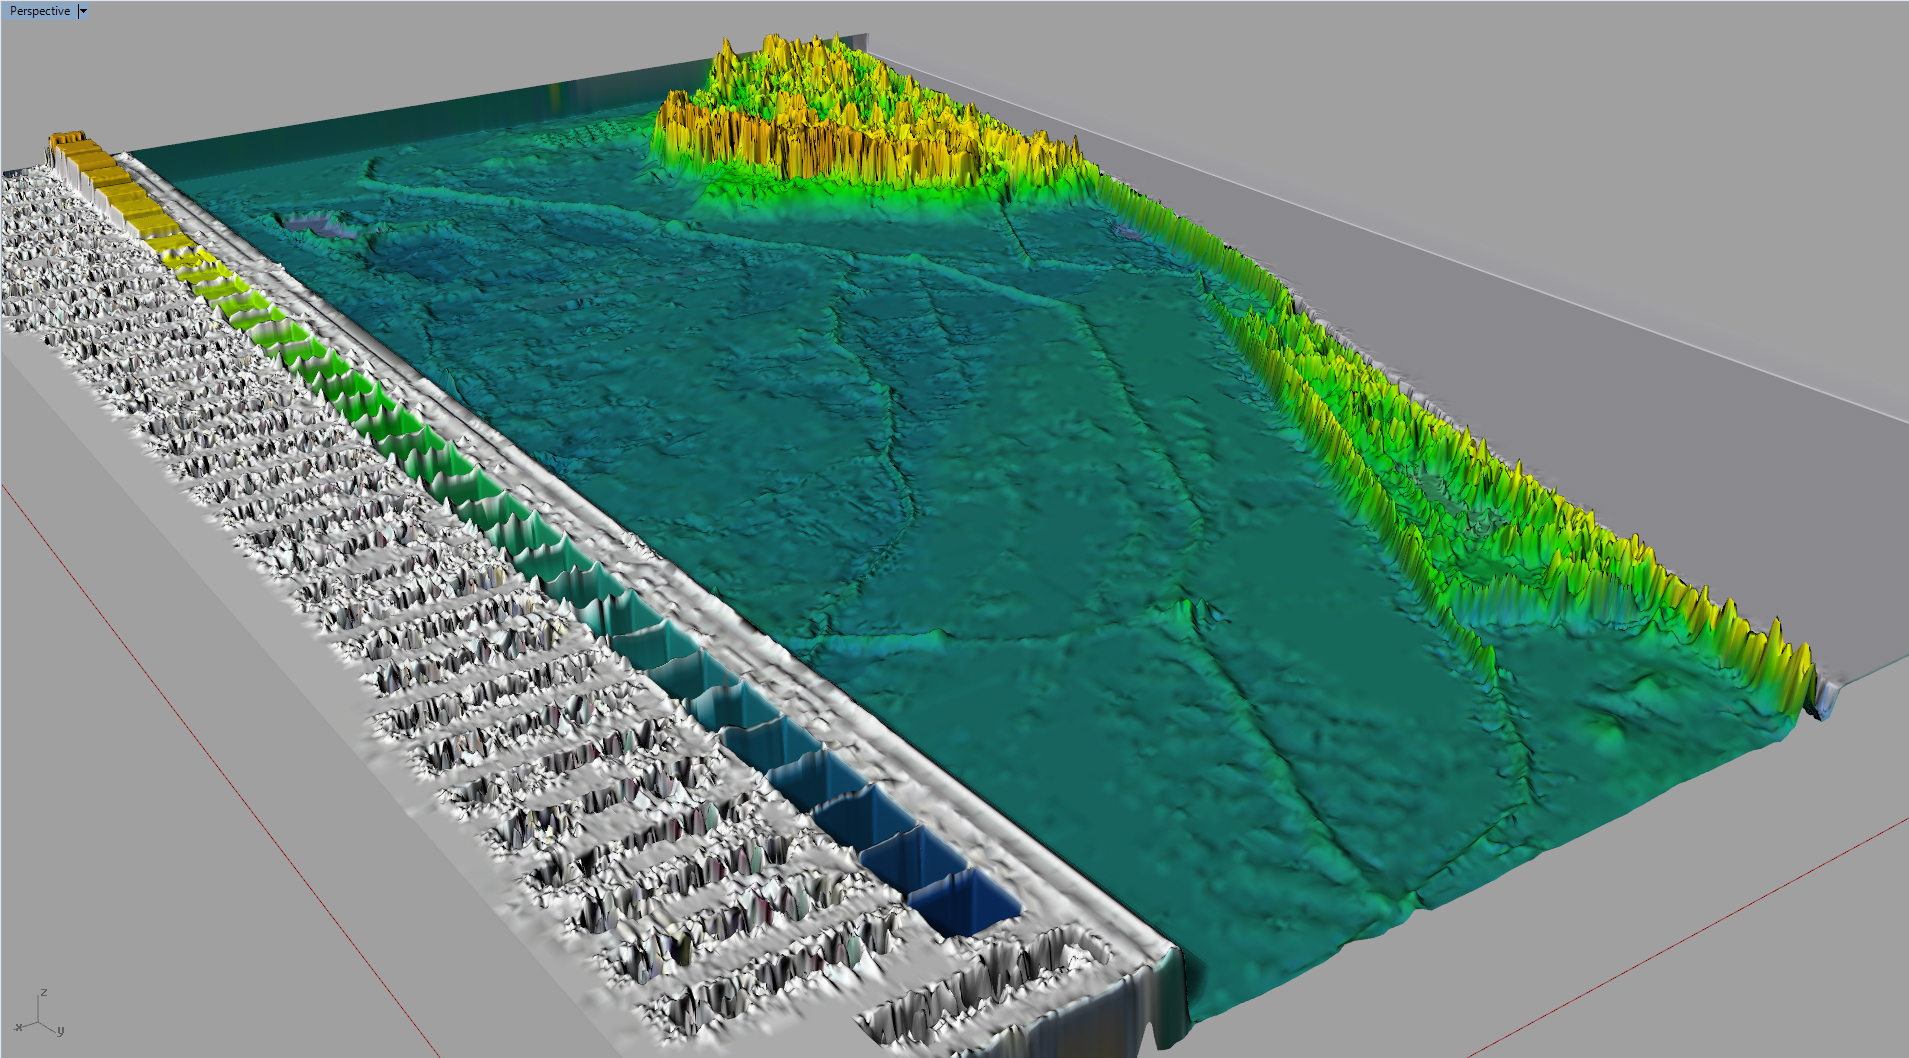
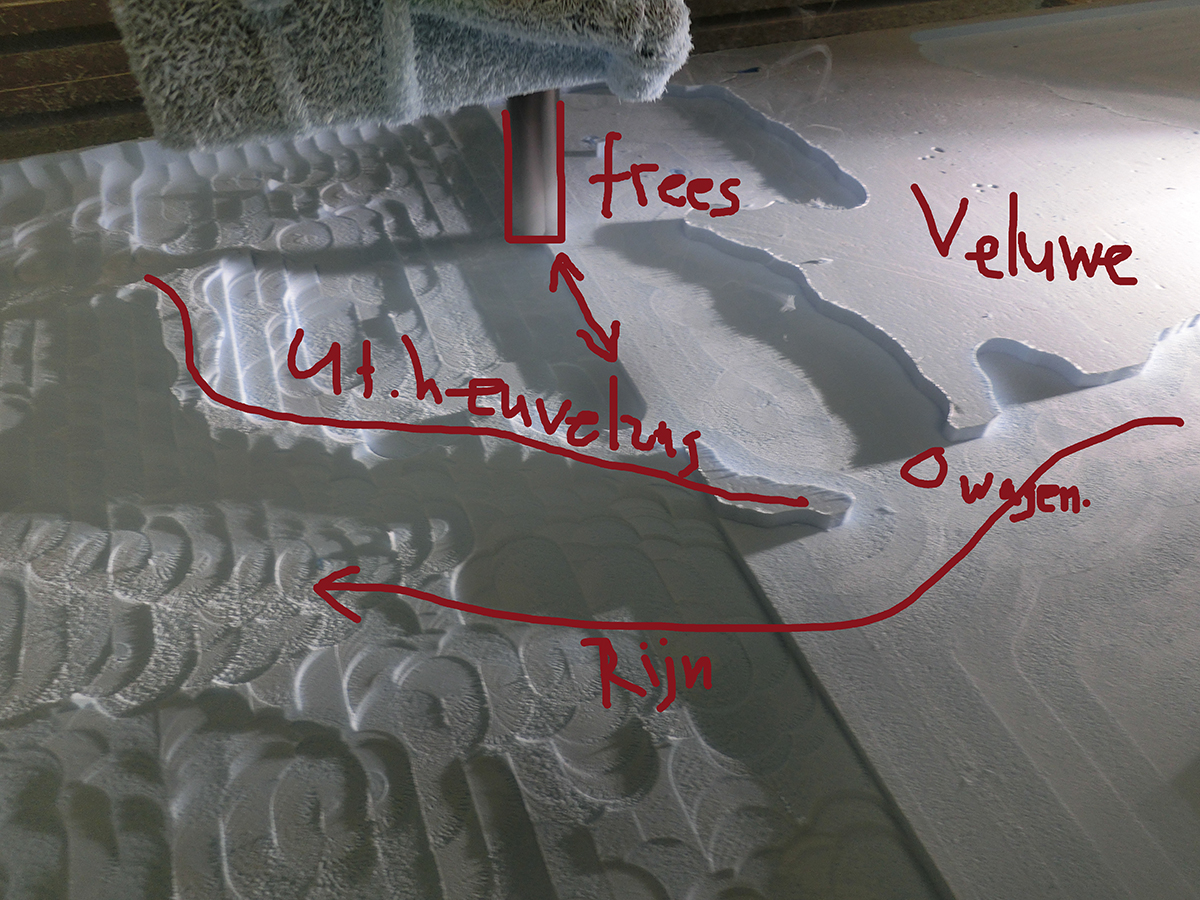
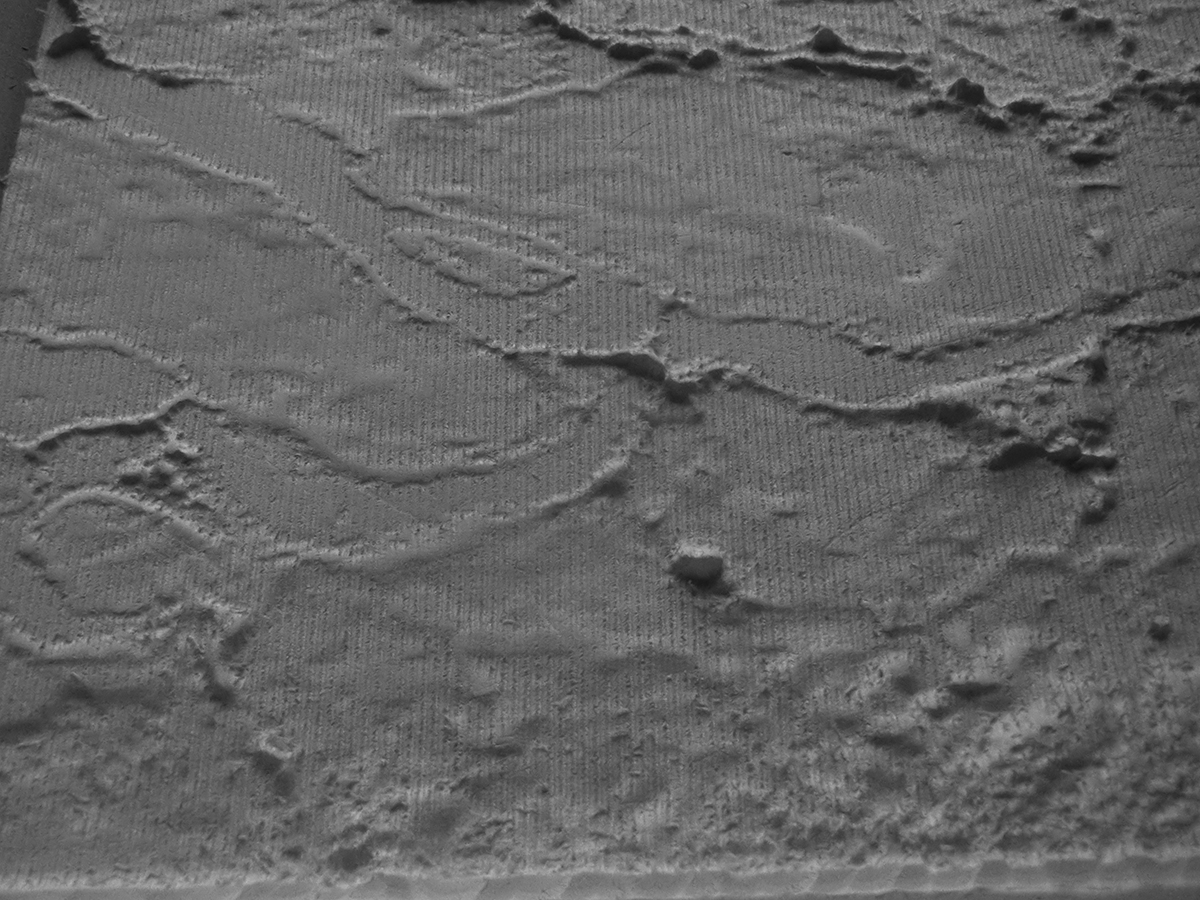
This is part of the Netherlands (near Wageningen, Veluwe, Rijn) being routed
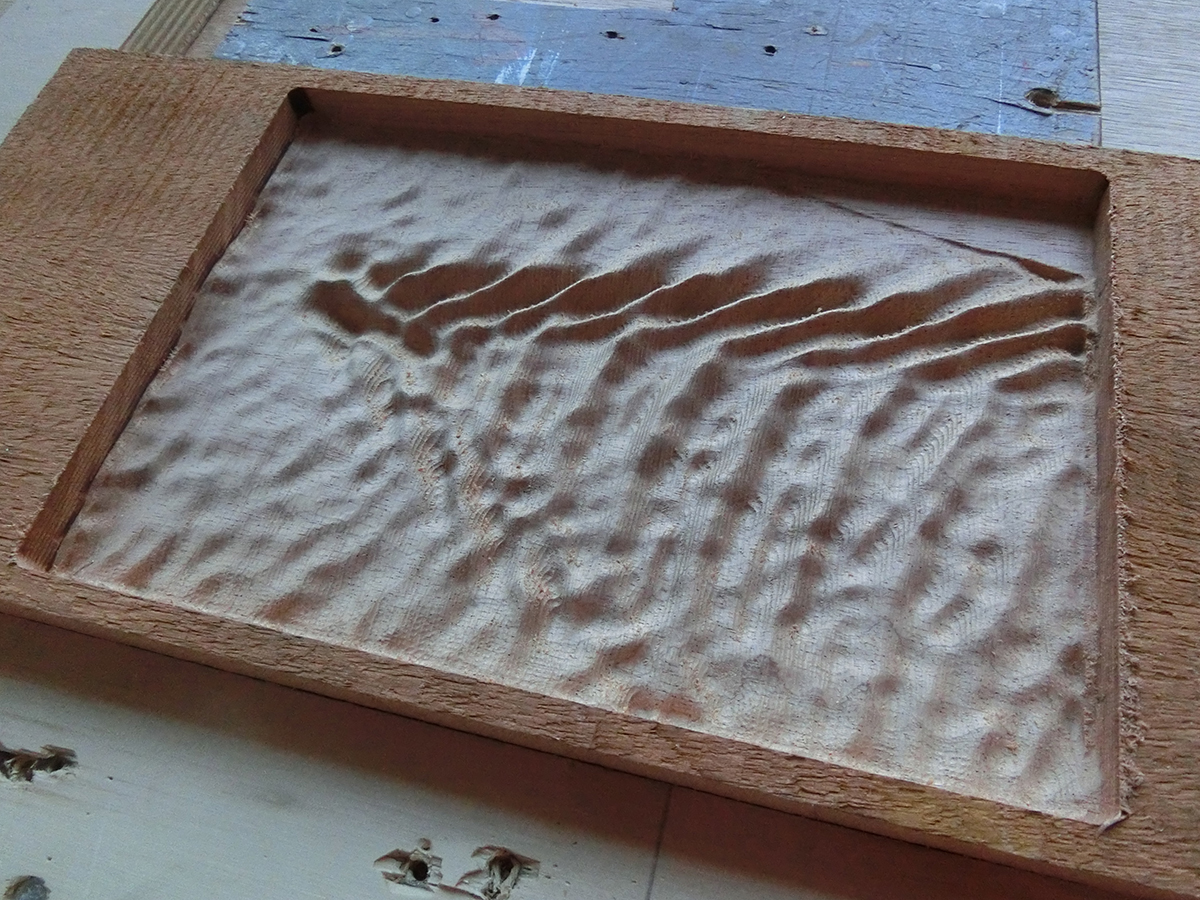
This is a more finished part: the estuary Haringvliet, Goeree Overflakkee,
island Tiengemeten, Hellegatsplein, Philipsdam